
Matplot library
Topics covered in last tutorials:
- Pandas
- Manipulating data using pandas
Matplotlib:
This is a plotting library for python. If you are familiar with plotting the figures in MatLab then these Matplotlib tutorials would be very easy for us. Let us understand how to import this library in the jupyter notebook.

Even though the library is imported in the jupyter notebook, plotting is not supported by the jupyter notebook. To allow a jupyter notebook for plotting we have to pass.

We have to pass these two things all the time we open a new jupyter notebook to access the plots in the notebook.
There are two ways to create a plot in jupyter notebook
- Functional method
- Object Oriented Method
Functional Method
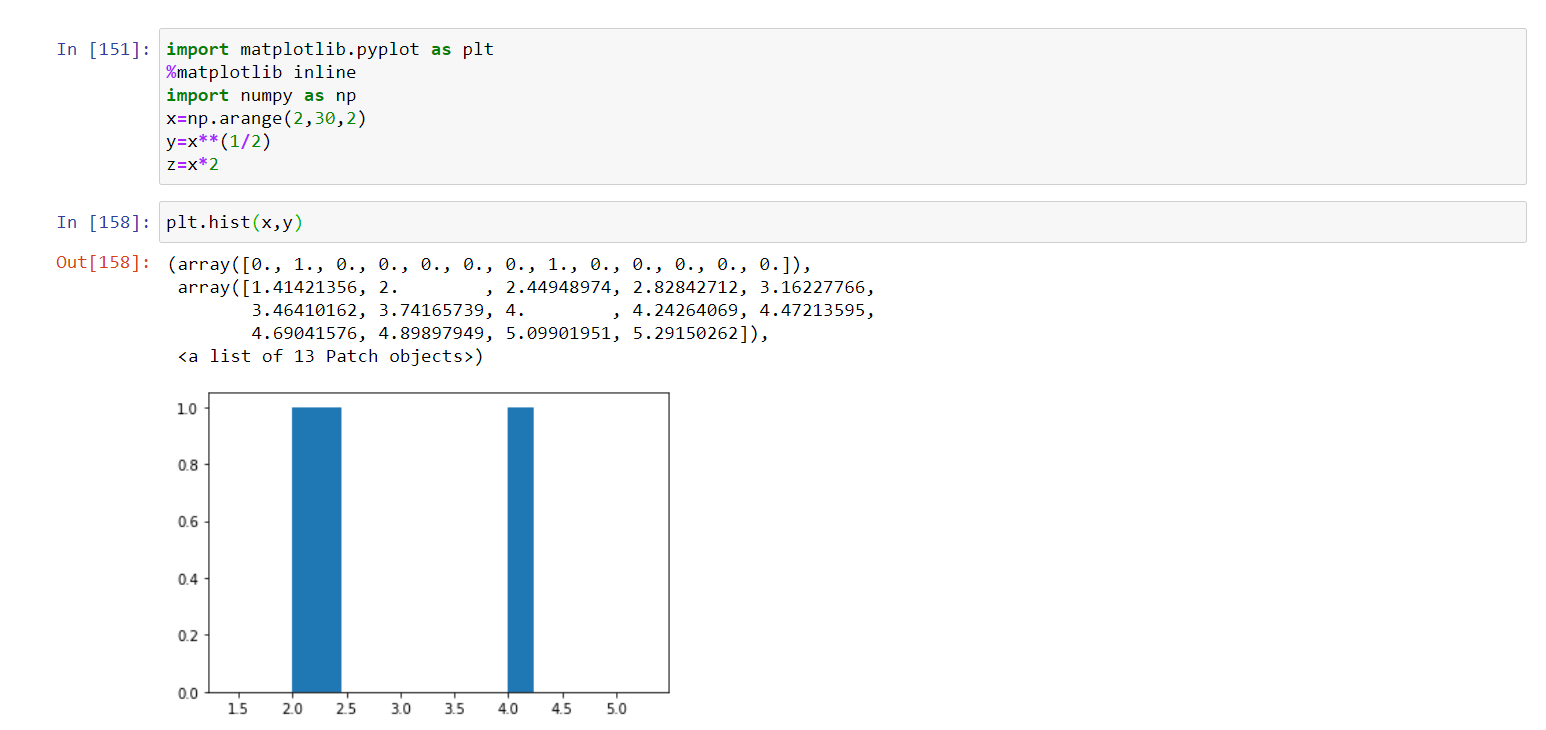
In this method we directly pass the things we wanted to get plotted . In this method we don’t have control over axes and other things. Let us plot something

This plot possesses very little information, Like it doesn’t have names of x-axis, y-axis, and even there is no plot name on top.
Now let us create another plot which possesses all this information.

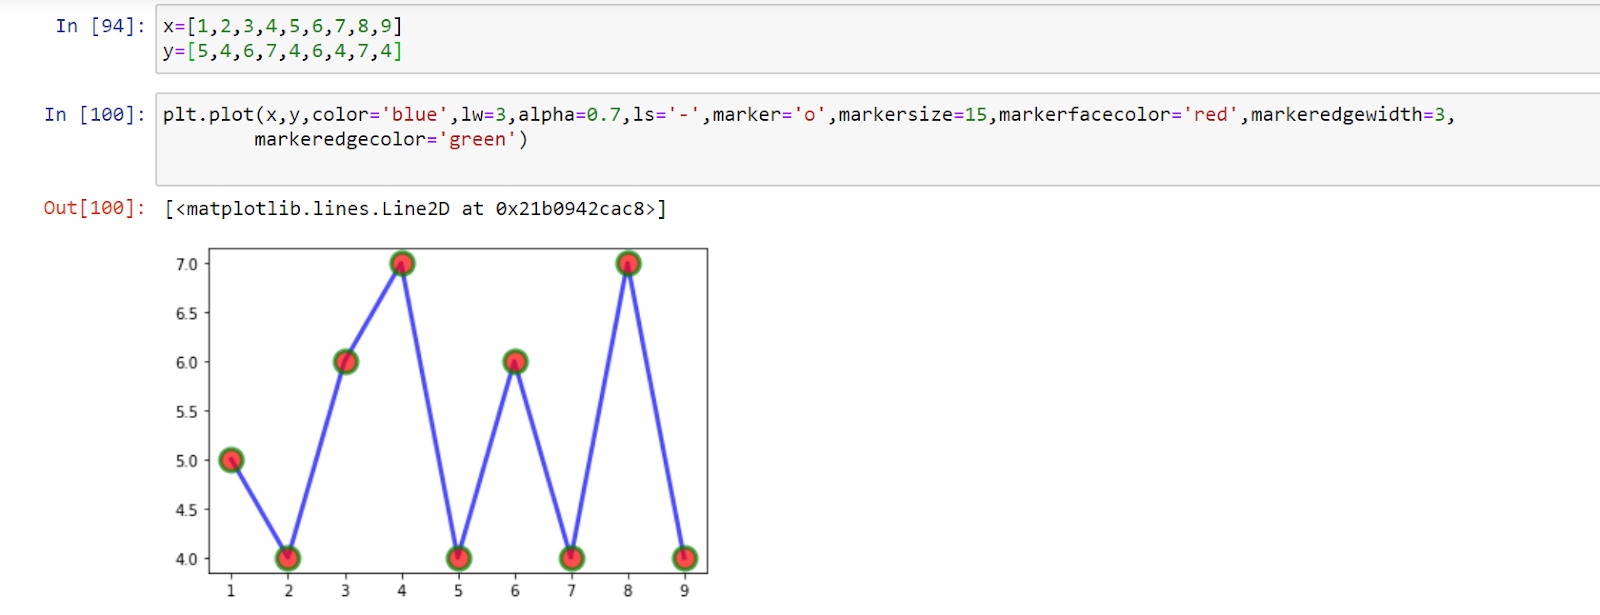
Parameters of plot ( ) :
| Parameter | It’s usage |
| color | This parameter takes input as color name or color hexa code and plots that colored plt. |
| linewidth or lw | This parameter takes integer values and varies plot width according to input |
| alpha | This takes values from zero to one and varies transparency of the plot. |
| linestyle or ls | This parameter changes the style of the line like dotted line, dashed line acc |
| marker | This parameter plots the coordinate points, we have to pass marker = ‘o’ which means circle the coordinate points |
| markersize | Size of coordinate pointa. |
| markerfacecolor | Color of the coordinate point |
| markeredgewidth | Boundary width of the marker. |
| markeredgecolor | Color of the marker edge |
Now let us see all these parameters in an example.
This was the functional method to create a plot. Now let us see one more operation we can do with this is that plotting multiple plots, by passing a function
plt.subplot( no_of_rows, no_of_cols , position )
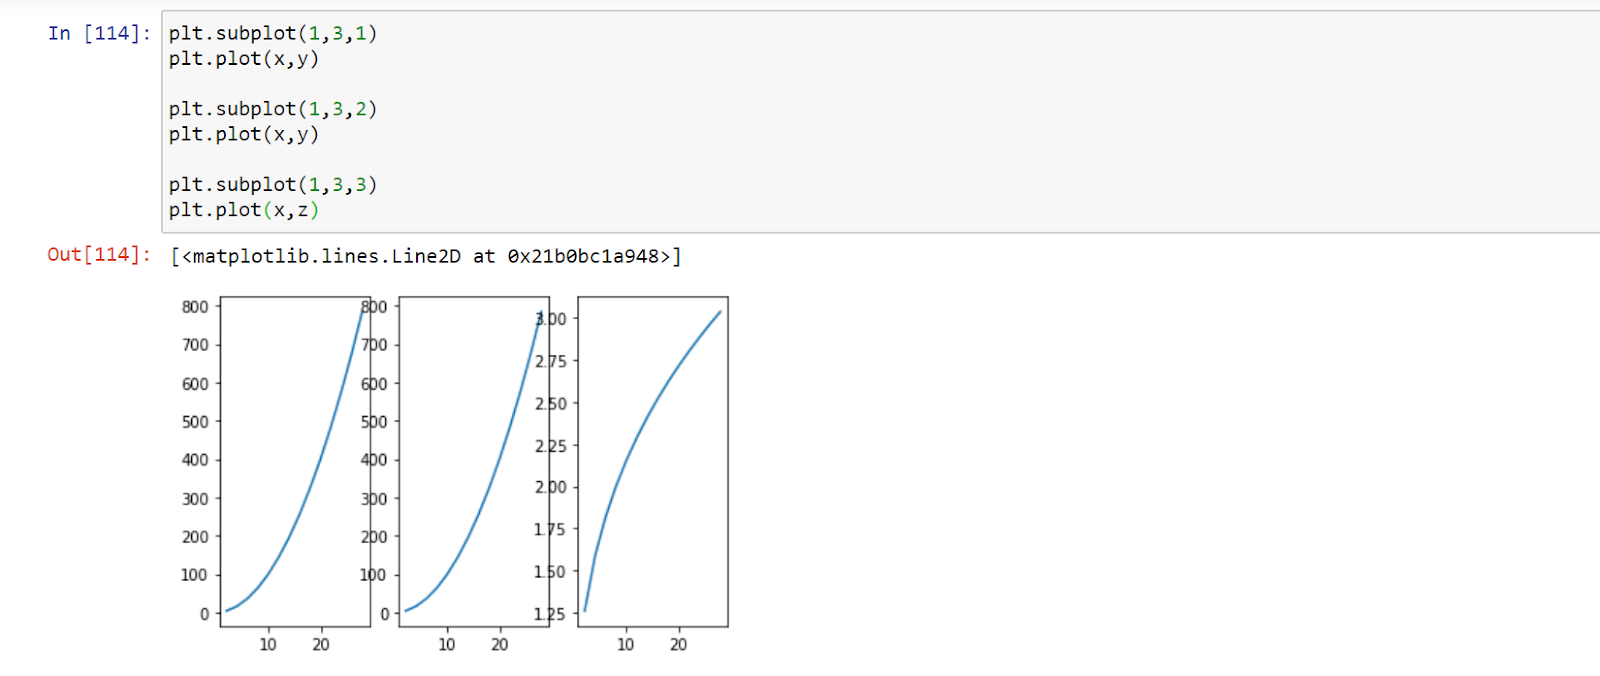
As in the above plotting we can observe that there is merging of graph with each other which actually doesn’t look good. Let’s do something pf this. Pass a function
Plt.tight_layout ( ) at the end and chech it
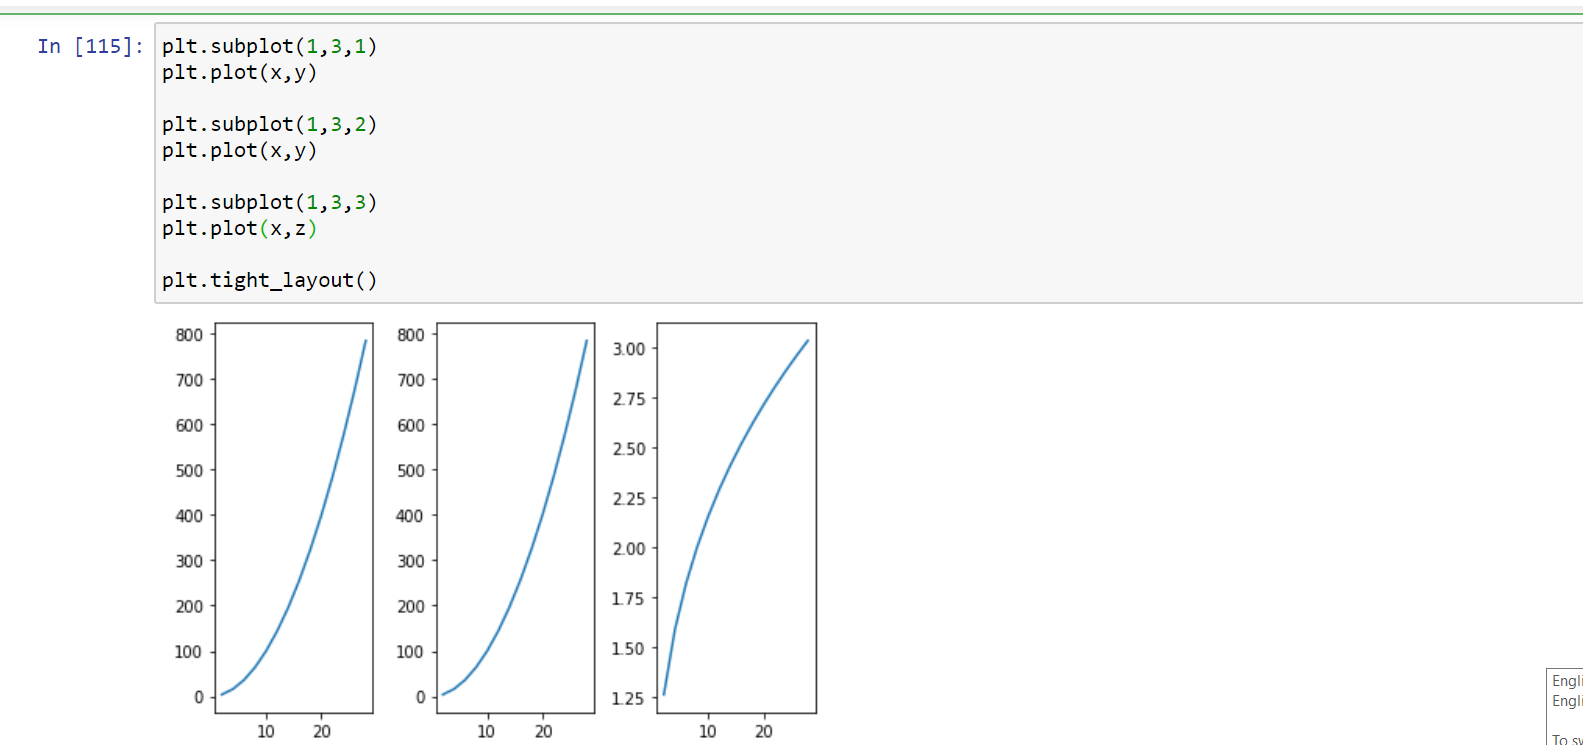
The issue solved out. So this was all about the functional method of plotting, and there is lot more we can do out of this, just keep practising!
Object Oriented method for plotting:
This method is something, you will understand as we get at last of the tutorial , In this method we have control over the axis , we can create the axis and can plot accordingly.
Firstly let us create axes by this method. Let us create the axes
oo_method = plt.figure ( )
axes = oo_method.add_axes( [ left, bottom, right, top ] ) #give this left, bottom, right ,top values to manipulate the size of the axes

Let us plot an equation.
import matplotlib.pyplot as plt
%matplotlib inline
import numpy as np
x=np.arange(2,30,2)
y=x**(1/2)
oo_method = plt.figure ( )
axes = oo_method.add_axes( [ 0,0,1,1 ] )
axes.plot(x,y)
axes.set_xlabel(‘xlabel’)
axes.set_ylabel(‘ylabel’)
axes.set_title(‘Title’)
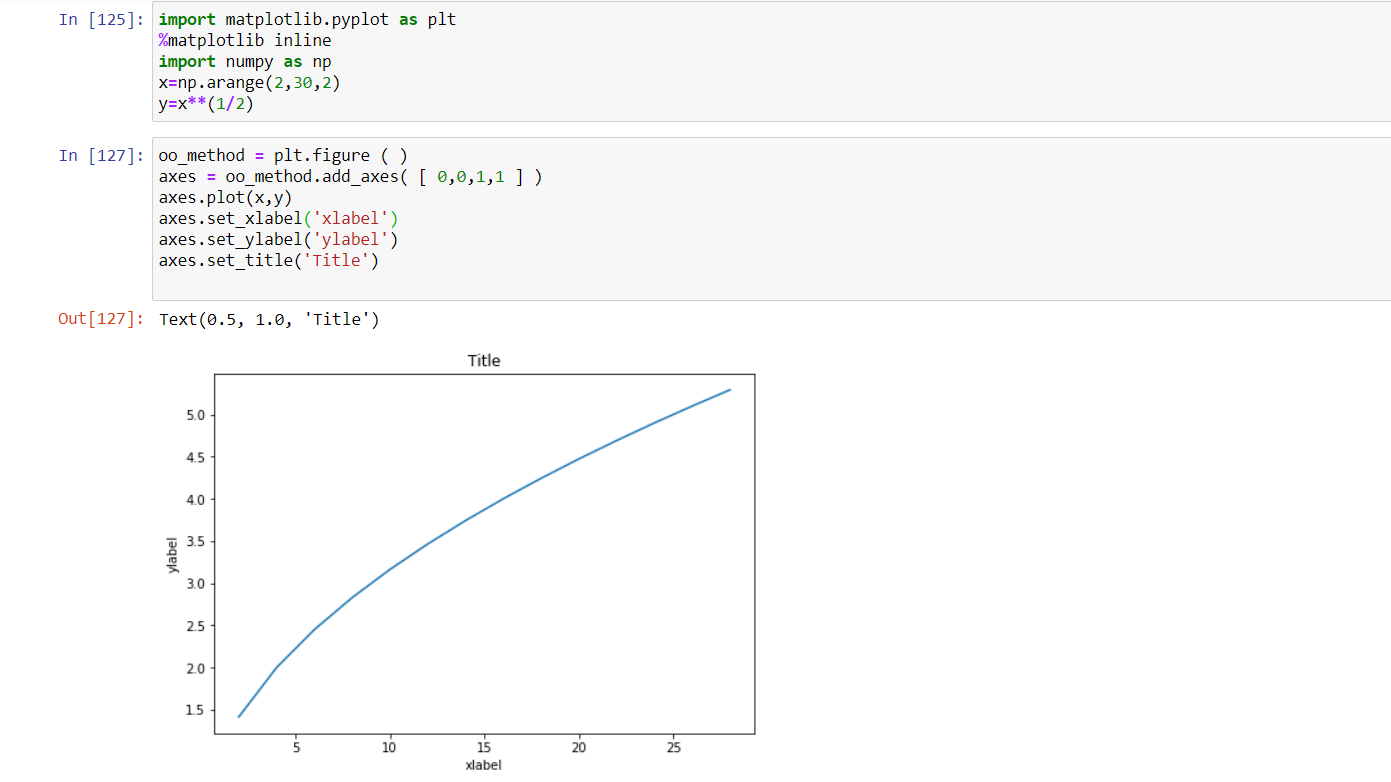
The same parameters can also be passed in object oriented method as we have passed in
plot ( ) function.
Now let us learn something interesting using matplotlib , could be done only using object oriented method

The position of that label can be varied by passing a loc=’int’ in the legend function.

Some other important plots :


This tutorial was for an introduction and overview of the Matplot library. Matplot library posses many such plotting features and all these would be added in these data science tutorials.
Topics in upcoming tutorials:
- Seaborn